

The date range can be up to 90 days. Data and tabs are also limited by your creator scope and Analytics permissions.
Dashboard tabs
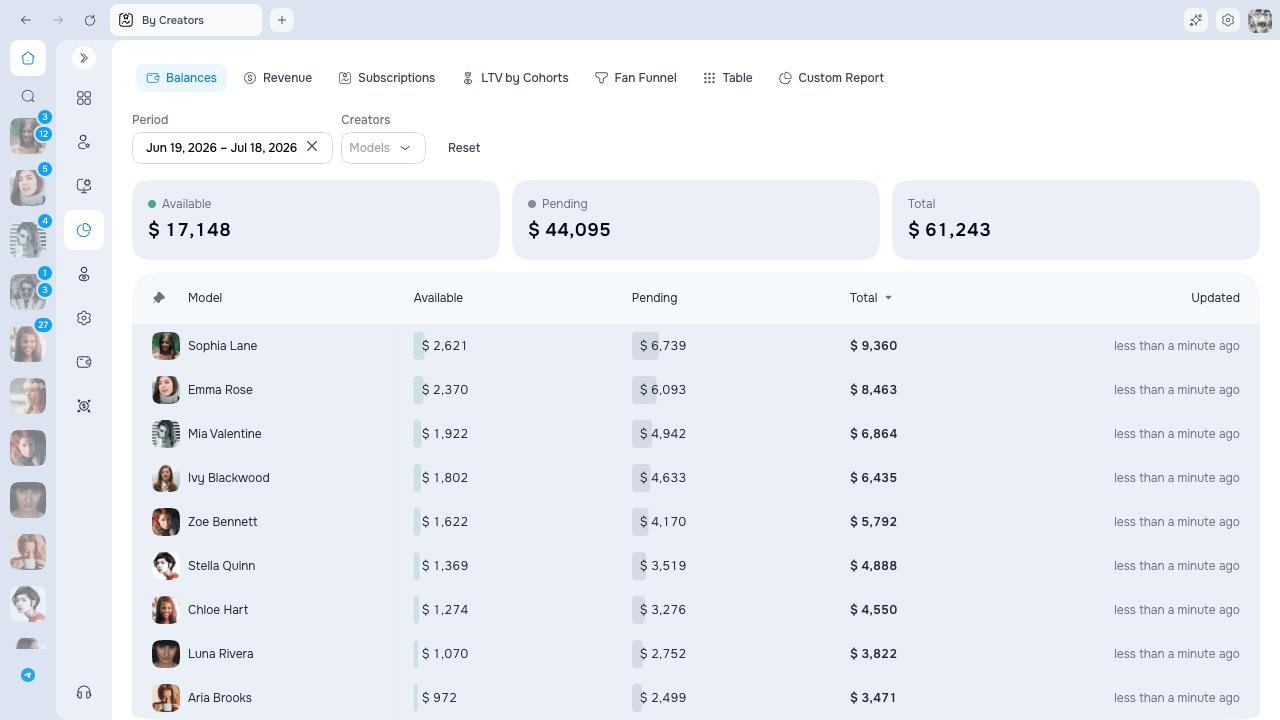
Balances
Balances shows Available, Pending, and Total for each selected creator. Check the Updated value before using a balance in an operational report; it tells you how fresh the latest synchronized value is.Revenue and subscriptions
Use the controls above each chart to change the time interval, chart style, and breakdown. Depending on the tab, you can compare the total with revenue or events by type or creator, switch between gross and net values, limit the view to top creators, and compare with the previous period. Export options apply to the currently configured chart.LTV by Cohorts
The cohort view groups fans by when they were acquired and shows Total LTV, fan count, Average LTV per fan, and the best-performing cohort. Break the result down by revenue type, creator, or acquisition source and choose gross or net values where available. Compare cohorts only after checking that they have had a similar amount of time to generate revenue. A newer cohort naturally has less history than an older one.Fan Funnel
The funnel follows these stages:- Subscribers
- Contacted
- PPV buyers
- Repeat buyers
Table
The table contains the core activity, PPV, tip, and revenue metrics. Creator rows can be expanded into employee rows. Use the period, creator, employee, and trend filters, configure visible columns, and export the result.Custom Report
Custom Report is not a built-in drag-and-drop report builder. Use the instructions on that tab to request a tailored setup through the AI assistant or contact Support.Permissions
Access to Creator Analytics starts with the Analytics → By Creators → View list permission. Balances, revenue, subscriptions, cohort LTV, and fan funnel have additional permissions, so your tab set may be smaller than a colleague’s. Creator scope controls which accounts appear in filters and results.Related pages
- Employee Analytics — attributed team performance and response time
- Metrics reference — Employee Analytics metric definitions
- Sales Settings — configure employee sales attribution